Customer Background
The client is one of the largest refiners and marketers of petroleum products with predominant operations in three countries, including the United States of America, Canada and the Middle East. They refine, market and distribute transportation fuels and manufacture and sell petrochemicals as well. They have 500+ facilities supplying oil and gas to distinct parts of the world. The client has installed thousands of sensors in their facilities that collect millions of data points every day.
-
Industry
Oil and Gas
-
Technologies / Platforms / Frameworks
Tableau
Challenges
Energy companies produce a large amount of data daily. This data is increasing every day as the industry is advancing with smart devices and installing sensors. However, managing such a humongous amount of data has been a tedious task for these companies in the absence of a suitable data analytics and visualization system.
Our client failed to take full advantage of the data generated through the sensors installed at each facility. So, they wanted a system to disrupt the data generated by their facilities every day. Also, they wanted to spot equipment issues and prevent monetary loss. The company needed a system to quickly analyze data and generate instant reports as per their requirements. Their main aim was to minimize downtime and maintain better recurrent revenue flows.
Solutions
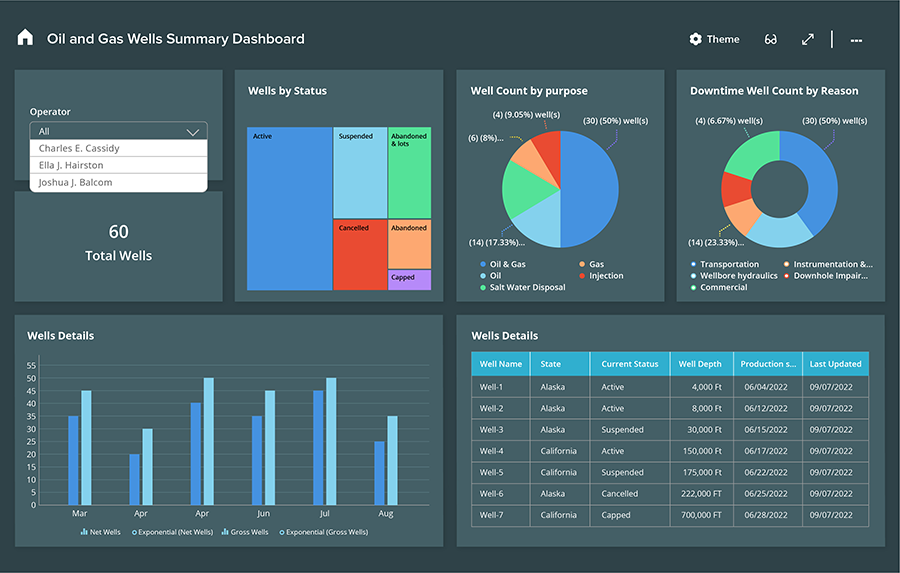
Our data experts analyzed the client’s entire business processes and identified the pain points hampering their business. Our visualization specialists integrated Tableau with all their data sources like MS Excel files, text files, database management systems and cloud storage. By leveraging Tableau, a robust and scalable platform, our data scientists helped the client to extract data from any platform, analyze it and make fast and effective decisions. They can now easily pull data from simple files or complex databases, data warehouses, or any web data using Tableau.
Tableau transforms data into a visually engaging and interactive form, and provides instant insights. It gives them a user-friendly drag-and-drop interface to visualize, comprehend and analyze the insights very easily in a short span.
With proper data processing and analysis using Tableau, we helped them in faster decision-making and quicker development. We also helped them adjust to the current market needs to achieve a competitive advantage. Our solution also helped them identify the problem areas instantly and address the issues beforehand, saving a lot of time.
Leveraging Tableau Desktop, we offered them various functionalities to build powerful calculations quickly using existing data. It helps them to analyze trends, lapses, and connections to validate statistical interpretation.
With Tableau data visualization, our client can analyze their data for the value that helps them to increase output, minimize downtime and improve customer service.
The solution helps them with:
- Live visual analytics for boundless data exploration
- Interactive dashboards to discover hidden insights instantaneously
- Connect to data on-premises or in the cloud
- Combining and accessing different data sets without writing code
- Comprehensive set of built-in features to cater to their business needs like constant monitoring, compliance, security and management
- Secure, compliant, scalable and reliable data analytics
- Boost output, lessen downtime and enhance customer service
- 50%
Faster data
analysis - 60%
Reduction in equipment downtime
- 40%
Improvement in customer experience
- 30%
Increase in upstream
operational efficiency

Need more information?
Tell us what you are looking for and we will get back to you right away!


