Customer Background
The client is a multinational energy corporation (MEC). They are headquartered in the United States and have spread its network all over the globe. They supply fuel to a few of the leading airlines and power suppliers. Since they have a vast clientele, their operations comprise hundreds of storage terminals, thousands of retail locations and more than 50 airports. The numerous operational data points in their storehouses capture and accumulate enormous data.
-
Industry
Oil & Gas
-
Technologies / Platforms / Frameworks
Power BI
Challenges
Business intelligence software consolidates data. However, in the absence of a data analytics solution, they struggle to gain insights to discover important measures and classify patterns to acclimatize quickly to the evolving business dynamics.
Our client generates a massive amount of data, but they do not have a way to merge, visualize or report it. This led to operational challenges like manual and lengthy reporting methods that were prone to errors. They had nominal visibility into their oil terminal and depot operations. They wanted to gain insights from their operational data into their finance, transportation, maintenance and energy consumption divisions. Also, they had no information to identify, analyze and control potential hazards at oil terminals and depots.

Solutions
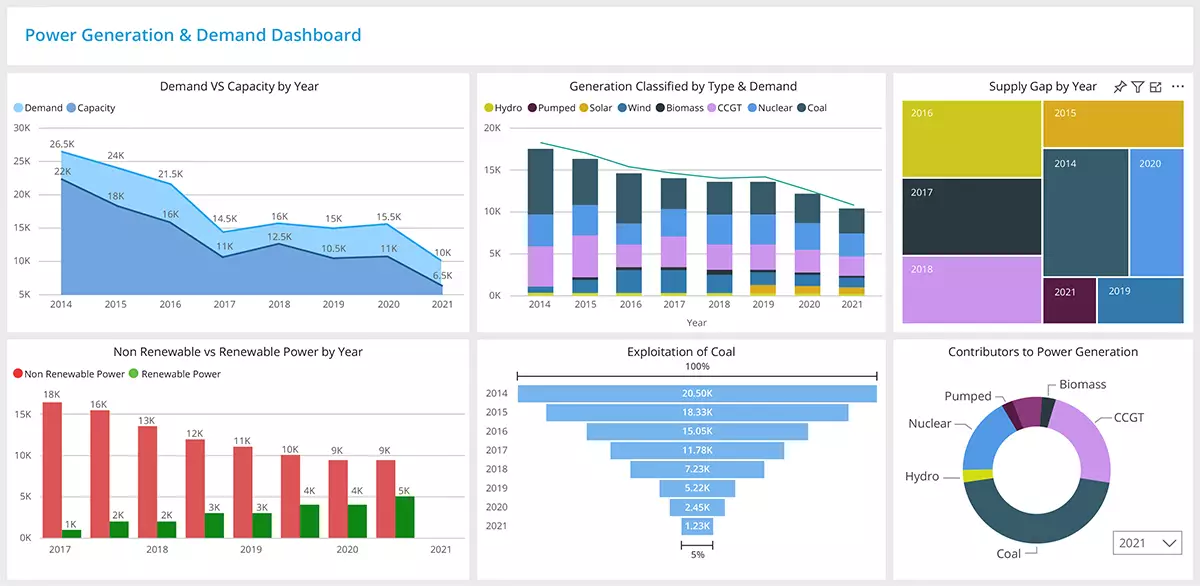
Our team analyzed the client’s needs and their operational processes. We integrated Power BI with their external data sources, Dynamics 365 CRM, ERP and other connected processes. Power BI helps our client to analyze data from multiple sources. Power BI energy consumption dashboards show how much power is being used over time and what their usage patterns look like. This helps them understand where they need to concentrate their efforts to minimize costs and increase efficiency.
Power BI allows them to easily share these dashboards with their team members and stakeholders. They can then use the information to make better business decisions about future investments and modify current processes.
Power BI provides real-time insights into their usage patterns and helps them identify trends and anomalies that would otherwise go unnoticed. It has enabled them to gain valuable insight into their operations. They can now monitor their performance and compare it against industry benchmarks.
Power BI for energy sector has also given them the ability to visualize complex data sets and make them easier to understand. Their teams no longer need to spend hours sifting through hundreds of pages of reports to find the information they want.
The solution helps them to:
- Analyze data efficiently
- Use existing solutions resourcefully without modifications
- Evaluate and analyze several resources easily
- Utilize advanced graphical user interfaces
- Empower the workforce to perform analysis independently
- Assess previous data on energy consumption
- Track energy usage
- Identify patterns, forecast risks and alleviate failures
- Measure energy generation and outages
- Solve issues in real-time
- 20%
Growth in
revenue - 25%
Decrease in time spent
on manual reporting - 35%
Improvement in company’s
overall performance - 30%
Reduction in
outages

Need more information?
Tell us what you are looking for and we will get back to you right away!


