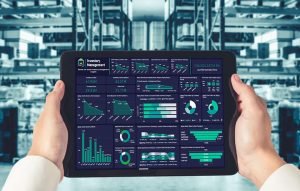
In today’s business environment, business intelligence (BI) tools have become increasingly popular in the retail industry. The previous years have forced consumers to shop online and restrain face-to-face interactions. To meet these fast-changing needs of customers, retailers are turning to Tableau.
Tableau is one of the leading analytics tools that enable retailers and wholesalers to transform their data into actionable insights. It embraces modern data visualization techniques and offers interactive dashboards. From store operations to digital content optimization, the Tableau dashboard for the retail industry provides a collection of options for visual analytics.
Let us see how Tableau dashboards help leading retailers thrive
Leading retailers do one thing differently to thrive i.e. to turn to data visualization for near real-time insights. They adopt a data-centric, consumer-focused approach to keep pace with their customer’s changing needs. It means they perceive and understand their retail data with Tableau retail dashboards to deliver outstanding customer experiences.
Tableau dashboards for retail business help leading retailers to perform the following tasks:
- Analyze the entire customer journey visually
- Build perceptive product and pricing strategies
- Get real-time data-driven insights into supply-chains
- Scrutinize customer’s buying patterns within seconds
- Personalize customer experiences across channels
Data360 Program = Customized Consulting + Services
Top five tangible examples of retail dashboards
1. Store operations dashboard
Even though online sales have risen since the beginning of the year 2020, brick-and-mortar retail is now making a slow return. The pandemic was not an end of in-store shopping but an accelerator for the growth of online sales. Hence, retailers still need to focus on their store operations. And this is possible using the store operations dashboard. Some of the store-level insights that you will get from this dashboard include:
- Product department performance
- Store’s daily sales trend
- Customer traffic and conversion rates
- Weekend v/s weekday sales
- YOY (Year Over Year) net sales growth
2. Stock in trade dashboard
It often happens that Retailers frequently face challenges maintaining fully stocked store shelves, leading to issues such as empty shelves or overflowing warehouses. To address this, the Stock in Trade Dashboard offers an ideal solution. It enables retailers to monitor stock availability in stores, providing real-time data to identify locations with dangerously low stock levels. Key insights provided by the dashboard include inventory management analytics tailored to retail needs, like:
- Store-level product availability
- If the inventory is under or over-stocked
- A graphical representation of cover and sales volume
- Warehouses stock cover target visually capped to 30 days
- Current demand compared with stock levels
3. E-commerce customer journey dashboard
In a mobile world, retailers must understand customers’ buying habits and track their digital buying journeys. E-commerce customer journey dashboard from Tableau will enable you visually analyze your e-commerce platform’s data. It will help you to make predictions about future purchases to satisfy customers’ modern needs. The visualizations are centered around marketing, merchandising, and store operations that will help you to understand customers’ habits. The Tableau customer dashboard provides real-time insights like:
- A quick view of e-commerce KPIs (Key Performance Indicator)
- A graphical representation of data from e-commerce platforms
- Real-time insights about customers’ online shopping activities
4. Merchandising assortment dashboard
For merchandisers and category managers, staying informed about rapidly changing customer demands is crucial. The Tableau performance dashboard allows users to analyze demand data in an intuitive way. It helps you to make informed decisions regarding product ranges and provides valuable insights into factors influencing higher conversion rates. This interactive retail dashboard offers visualizations for an overview of assortment performance, such as:
- Sales and margin performance by sub-category
- Top-selling brands and seasonal trends by category
- Private brand v/s national brand assortment mix
- A quick view of top-selling products with maximum revenue
- Style, color and size performance of different products
5. Digital content optimization dashboard
According to Statista’s latest reports, global retail digital commerce sales grew by 25.7% in 2020. Also, during the same year, more than two million people turned to online shopping. As the number of digital buyers increases, retaining them becomes more and more challenging. For better customer engagement and higher conversion rates, you need to optimize digital content. Tableau’s digital content optimization dashboard provides richer insights on different digital assets including, text, image, and video. Using this retail dashboard, you can perform the following tasks:
- Create a quick view of asset analysis metrics
- Comply with brand standards for the highest conversion
- Define future state action plans
- Right-size digital asset capabilities
- Get actionable improvement recommendations
Experience the power of visual analytics!
The transition to the digital world has been rapid, and retailers who have prioritized modern technologies are turning to data visualization. So, whether you have just hopped onto the data analytics journey or are already leveraging it, you need to realize the power of retail dashboards. Tableau retail dashboards possess the power to bring actionable insights to life. If you are not sure about how to derive the maximum benefits from your retail data using Tableau dashboards, then get in touch with our Tableau consultants. Apart from retail business operations, you can utilize Tableau dashboards for performing different tasks. Know how Tableau dashboards can help you in financial reporting.


