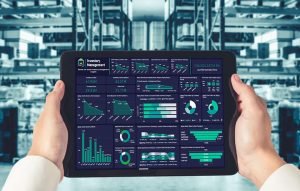
Businesses are capturing and storing data for the last few decades and now they want to refine this bulky data to gain useful insights by applying data engineering and data science. Visualizations play an important part in making this data useful to decision makers.
It helps them identify new patterns by explaining concepts clearly and deeply. Nowadays, with the advent of information technology, visual analytics are helping enterprises to make smarter decisions more quickly as both time and information are important. With interactive visualizations you can conceptualize future business strategies by drilling down into charts and graphs.

Let your data tell your business story with Tableau
Webinar agenda
- Overview of Tableau and integrations
- Various data visualization trends
- Must have data analytics trends in 2021
- Use cases and live demo
- Present day examples/ case scenarios
- Q & A
R is a widely popular statistical language that is used by data scientists to perform statistical analysis and predictive analytics. This includes statistical tests, time-series analysis, linear and nonlinear modeling, classification, clustering, etc. Tableau on the other hand is a data visualization tool which helps people to understand the data through interactive visuals.
When a free, popular, and open source language combines with an advanced data visualization tool it creates a dream team combination for developing interactive visual analytics. R provides a powerful way to perform statistical analysis on big data sets. Being an open source technology, you can create new packages and functions anytime.
R models and functions can be used in combination with Tableau by developing new calculated fields to pass values to R. The results are then returned back to Tableau for further usage by the Tableau visualization engine. This ultimate combination of R with Tableau supercharges data with visual analytics. It helps anyone quickly analyze, visualize and share information. People use this ultimate combination at their workplace or even on the go on their mobile devices.
[Tweet “How #Tableau integration with #R can give you excellent visualizations”]
Businesses can use Tableau to explore and find quick patterns and then code those into R to reproduce the patterns for all various combinations. It helps you build dashboards together in a short amount of time. Now you can create multiple charts and in the meanwhile you need to eliminate various useless charts as well for getting meaningful insights.
The integration benefits are as follows:
- Get the statistical analysis on Tableau data.
- Get the access to any R package or function that has been installed in R server.
- Take advantage of all the visualization capabilities in Tableau to further analyze and understand the data without manipulating it in R.
- Several R packages offer predictive capabilities and you can leverage it by integrating with Tableau.
There are also some limitations that you need to consider while integrating Tableau with R. Visualizations created in R cannot be imported directly into Tableau but the image files of R visualizations and URLs can be used in the Tableau dashboard. You should consult data experts before implementing R integration with Tableau for your business.
At Softweb Solutions, we consult enterprises about the usage and procedures to harness the power of big data with the help of the latest technologies. Get in touch with our data scientists to get a complete overview on how you can convert your data into meaningful and actionable insights.
Data visualization is a wise investment in your big data future to make your business more predictable and profitable by eliminating risk factors. Let’s unlock the treasure trove of big data stored in your enterprise’s database and unleash big opportunities for your business.


